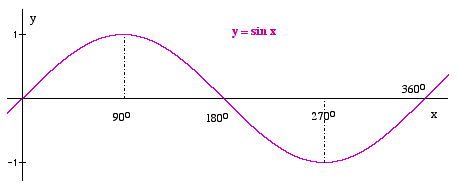
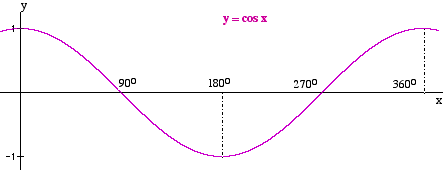
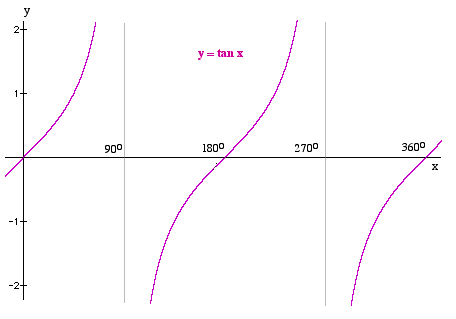
 From the trigonometric values for various angles, the following graphs can be drawn. The graphs are usually shown between 0°and 360°, but can be continued for angles less than 0° and greater than 360°.
(a) y = sin x

Click Here to see the graph of y = sinx being formed.

Click Here to see the graph of y = cosx being formed.

Click Here to see the graph of y = tanx being formed.
- These graphs have a regular pattern and so are called periodic functions.
- The maximum value of the sine and cosine graphs is 1 and the minimum value is -1.
- The tangent graph has asymptotes at 90° and 270°. i.e. tan 90° and tan 270° are said to be undefined.
As the angle gets closer to 90° and 270° the value of the tangent tends towards infinity ( ).
).