| 1. |
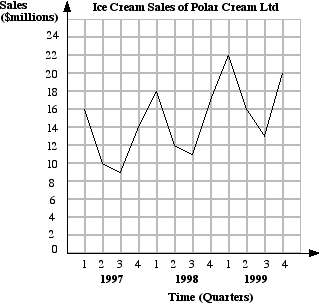
Use the time series shown to answer the following questions: a. What was the sales figure for the second quarter of 1998? b. Which quarter and year produced the highest sales figure for Polar Cream Ltd? c. Which quarter and year produced the lowest sales figure for Polar Cream Ltd? d. Give a reason why sales are lowest in the third quarter of each year. e. Why do you think that sales peak in the first quarter of each year? f. Give some figures to show why the manager of Polar Cream Ltd is justified in saying that sales are rising. g. Make a prediction for the company's sales for the third quarter of the year 2000. |
 |
2. The table below shows the number of videos issued from a video library over a 18 day period.
| Day of Week |
M
|
Tu
|
W
|
Th
|
F
|
Sa
|
Su
|
M
|
Tu
|
W
|
Th
|
F
|
Sa
|
Su
|
M | Tu | W | Th |
| Number of videos issued |
48
|
55
|
65
|
105
|
150
|
155
|
160
|
45
|
55
|
70
|
95
|
130
|
136
|
126
|
35 | 57 | 64 | 89 |
a. Draw a time series graph for the above data.
b. Smooth the time series graph by taking a moving mean of order 5 and draw on the same graph as in part a.
c. Comment on the shapes of the two graphs.
d. Why would 7 have been a better order for the moving mean?