1. David collects samples of blades of grass from two areas. He is investigating the length (in millimetres) of the grass.
The samples have the following statistics:
|
Median
|
Upper quartile
|
Lower quartile
|
Maximum value
|
Minimum value
|
|
| Sunny area |
40
|
51
|
25
|
65
|
16
|
| Shady area |
23.5
|
31
|
19
|
43
|
12
|
a. Show this information on two side-by- side box plots.
b. Make a conclusion about the effect of sunlight on the length of grass based on these results.
2. For a sample of 40 measurements, the following statistics are available.
Maximum = 23
Minimum = 6
Quartiles are 8 and 18
Σ x = 453 and Σx2 = 5803a. Find the mean and standard deviation.
b. Draw a box and whisker plot to show the data, given that the median is 11.2.
c. Suppose that 4 was added to each value. What would the mean and standard deviation now be?
3. A large group of students sat two French tests. The following box and whisker plots were drawn from the results.

Mark (%)
a. What are the two median marks for the tests?
b. The distribution of marks for test A is skew. Explain briefly how the plot shows this.
c. Compare the spread of marks between the two tests.
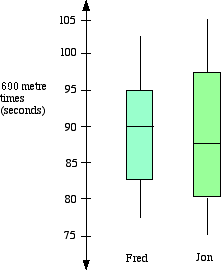
4. Two runners Fred and Jon record their times over 600 metres at training for a season.
The box and whisker diagram below show these results.

a. Use the graph to copy and complete the table below.
Median Upper quartile Lower quartile Highest time Lowest time b. Comment briefly on the performances of the two runners.
