| 1. The table shows the areas of 20 highest mountains in Australia and New Zealand.
Show this information on a stem and leaf diagram, using the first two digits as the stem. |
 |
|
Name of mountain |
Location |
Height (in metres)
|
|
Malte Brun |
NZ |
3160
|
|
Kosciuszko |
NSW |
2230
|
|
Silberhorn |
NZ |
3300
|
|
Bogong |
VIC |
1990
|
|
Tasman |
NZ |
3500
|
|
Torres |
NZ |
3160
|
|
Jaggungal |
NSW |
2040
|
|
Sefton |
NZ |
3160
|
|
Townsend |
NSW |
2210
|
|
Lendenfeldt
|
NZ
|
3190
|
|
Tate
|
NSW
|
2040
|
|
Cook
|
NZ
|
3750
|
|
Paddy Rushs Bogong
|
NSW
|
1920
|
|
Teichelmann
|
NZ
|
3160
|
|
Perisher
|
NSW
|
2040
|
|
Dampier
|
NZ
|
3440
|
|
Twynham
|
NSW
|
2180
|
|
Gungartan
|
NSW
|
2060
|
|
Hicks
|
NZ
|
3200
|
|
Feathertop
|
VIC
|
1920
|
2. The final examination results of a class are given below. The results are shown below:
|
Year 11 Examination
|
43 |
46 |
68 |
85 |
66 |
46 |
71 |
49 |
81 |
93 |
|
42 |
63 |
72 |
55 |
68 |
76 |
50 |
43 |
53 |
38 |
(a) Draw a stem and leaf diagram for this class.
(b) What is the difference between the highest and the lowest score.
(c) What is the median (middle) score in the test.
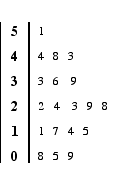
3. The unordered stem and leaf graph below shows the number of tries scored in a rugby championship by teams in the top two divisions in a season.
The numbers in the stem represent tens.
 |
 |
a. Arrange the numbers on the leaves into order from smallest to largest.
b. What was the highest number of tries scored in the season?
c. What was the lowest number of tries scored in the season?
d. How many teams were there altogether?
e. What was the median (middle) number of tries scored?
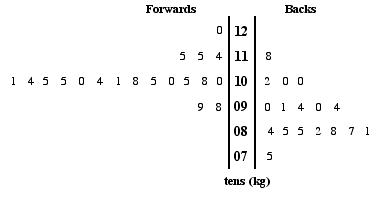
4. The unordered back to back stem and leaf graph below shows the weights of the forwards and backs in a rugby squad that toured South Africa.

a. Arrange the numbers on the leaves into order from smallest to largest (remember to start at the stem!).
b. How many players were in the squad?
c. Was the heaviest player, a forward or a back?
d. Find the median (weight) for a back.
e. What weight was the lightest player in the squad?
5. Three fair coins are tossed. One side is called "heads" and the other side is called "tails". Draw a tree diagram to show all of the possible combinations and use the diagram to find the probability that:
a. All three coins are tails
b. There are two heads and a tail (in any order)
c. There are no tails.
d. The first coin is a tail.
6. The table shows the areas of 20 major natural lakes in New Zealand with areas less than 100 square kilometres. Show this information on a stem and leaf diagram, using the first digit as the stem.
The digits on the leaves should be arranged in order from smallest to biggest.
Name of lake
Length (in square kilometres)
Rotorua
80
Rotoiti
34
Tarawera
36
Waikaremoana
54
Wairarapa
80
Rototoa
23
Brunner
39
Coleridge
36
Tekapo
88
Ohau
61
Monowai
31
Hauroko
71
Poteriteri
47