Probability in mathematics is a measure of how likely it is that an event will happen.
The probability of an event happening can be estimated from an experiment or survey or calculated theoretically.
 Relative frequency
A fair six-sided die was thrown 1000 times and the results were recorded in a frequency table.
The relative frequency is the FRACTION or PROPORTION of a particular category.
e.g. 160 out of the 1000 throws were a SIX so the relative frequency of getting a six is 160/1000 = 0.16
|
Number on die
|
Frequency
|
Relative frequency
|
||
|
Fraction
|
Decimal
|
Percentage
|
||
|
1
|
175
|
175/1000
|
0.175
|
17.5%
|
|
2
|
170
|
170/1000
|
0.17
|
17%
|
|
3
|
168
|
168/1000
|
0.168
|
16.8%
|
|
4
|
172
|
172/1000
|
0.172
|
17.2%
|
|
5
|
155
|
155/1000
|
0.155
|
15.5%
|
|
6
|
160
|
160/1000
|
0.16
|
16%
|
|
Total
|
1000
|
1
|
1
|
100%
|
These results are based on an experiment.
In theory each of the numbers above are equally likely, providing the die is not biased. This means that the probability of getting each number is 1 / 6 , 0.16.... or 16.7%.
In the experiment above, if the die was thrown 10, 000 times, each of the relative frequencies would be nearer to 1 / 6.
See another probability experiment, with a spinner − ![]()
(This activity was created by the Shodor Education Foundation.)
Probability
- Probabilities are expressed as fractions, decimal fractions or percentages.
- An outcome is the result of an action such as throwing a die or picking a card from a pack.
- For equally likely outcomes, the probability of the event E occurring is given by:
Probability of event E happening =

|
When a die is tossed, what is the probability that a 5 or a 6 will face up? |
Total six possible outcomes = {1, 2, 3, 4, 5, 6} Required two outcomes= {5, 6}
|
|
A card is picked from a normal pack of 52. What is the probability the card will be a heart? |
There are 52 cards in a pack. There are 13 hearts. P(Heart) = 13/52 = 0.25 |
Probabilities will always be in the range from 0 to 1.
If the probability of an event happening is 0, the event cannot occur.
If the probability of an event happening is 1, the event is certain to occur.
e.g. P(throwing a six-sided die and scoring a 7) = 0P(throwing a six-sided die and scoring less than 7) = 1
See an activity involving probabilities when throwing two dice − ![]() .
.
(This activity was created by the Shodor Education Foundation.)
Expected value
The expected value of an event occurring from a certain number of trials is the number of times the event is expected to occur.
Expected value = (Probability of event) x (the number of trials)
= P(E) x n
Example Answer If a die is thrown 60 times, how many times would you expect a 4 or a 5 to be thrown?
Tree Diagrams 
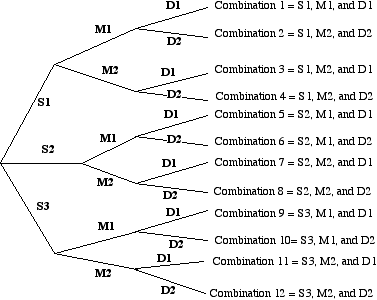
A tree diagram can help to solve probability problems or problems involving the number of ways that a combination of things can be carried out.
e.g. At a dinner, there are three types of soup, two types of main course and two desserts. How many different meals could be ordered?
This problem can be solved with the help of a tree diagram:
Let the soups be S1, S2 and S3
Let the main courses be M1 and M2
Let the desserts be D1 and D2
As can be seen there are 12 possible combinations of courses.
(This type of problem can be done using the multiplication principle: 3 ways x 2 ways x 2 ways =12 combinations


