 Linear functions have graphs which are straight lines.
The general equation of a linear function is ax + by + c = 0.
The exponents of both the x term and the y term are 1.
Another often used form of linear functions is y = mx + c.
Definitions
- A Cartesian graph is a graph drawn on a number plane with two perpendicular axes.
- Coordinates are the ordered pairs that locate points on a graph. The first number is the distance of the point along the x-axis (horizontal) and the second number is the distance of the point along the y-axis (vertical).
- Each point is located by an ordered pair. e.g. (x, y), (3, 4)
- The origin is the point where the two axes intersect. The origin has coordinates of (0, 0).
- The intercepts of a graph are the points where the graph cuts the x-axis and y-axis.
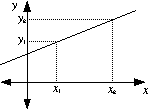
Gradient
The gradient of a straight line is a measure of its slope.
The gradient, m is defined as:
|
= |
|
Types of gradient
|
A line sloping upwards from left to right has a positive gradient. |
m is positive |
|
|
A line sloping downwards from left to right has a negative gradient. |
m is negative |
|
|
Parallel lines have the same gradient. |
m1 = m2 |
|
|
A horizontal line has a gradient of 0. |
m = 0 |
|
|
m is undefined |
Click Here for practice at calculating gradients.
Sketching Straight Line Graphs
There are several ways to sketch the graphs of linear functions.
Plot points. Choose two convenient values for x and complete the ordered pairs for the function. Join these two ordered pairs. Check that a third value for x also gives a point on the line.
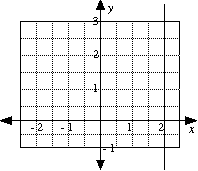
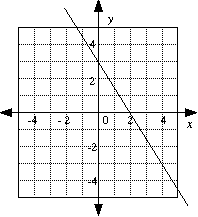
e.g. y = 2x + 1
|
Put x = 1 Put x = 2 Check: When x = 3, y = 7 It is sometimes useful to put these values in a table. |
|
Intercept method.
Find the two intercepts by putting x = 0 into the equation and finding the corresponding y value.
Then put y = 0 into the equation and find the corresponding x value.
This gives the values of x and y where the graph cuts the axes.
e.g. 3x + 2y = 6
|
Put x = 0 Put y = 0 |
 |
Gradient / Intercept method.
If the equation is written in the form y = mx + c, where y is the subject of the equation, then:
m, the coefficient of x, is the gradient of the line,
and c, the constant term, is the y-intercept.
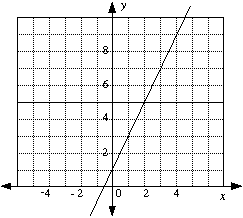
e.g. y = 2x + 1
|
By inspection of the above equation: Gradient is 2 |
 |
Special Types of Straight-line Graphs
Lines passing through the origin. If the equation has no constant term, it passes through (0, 0).
|
e.g. y = 2x By inspection of the equation: Gradient is 2. |
|
Lines parallel to the x-axis. These lines have equations of the type y = c, where c is a constant.
|
e.g. y = 2 Note: no x-term. |
|
 y = 2
y = 2
Lines parallel to the y-axis. These lines have equations of the type x = c, where c is a constant.
|
e.g. x = 2 Note: no y-term. |
|