 Quadratic functions have graphs that are parabolas.
The general equation of a quadratic function can be given in two forms:
In both forms the highest exponent of x is 2.
The vertex, stationary point or turning point gives either the maximum or minimum value of the function.
Sketching Parabolas
Method 1: Factorisation.
If the equation is in the form y = ax2 + bx + c the following method should be used:
Step (a) Factorise the function. Step (b) Find the x- and y-intercepts by putting y = 0 and x = 0. Step (c) Step (d)
Method 2: Transformation.
This method finds the coordinates of the vertex.
The y-intercept is found by putting x = 0.
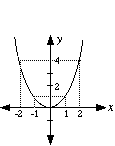
The graph of the basic parabola y = x2 is shown in the diagram.
This basic parabola is moved or transformed as follows:
|
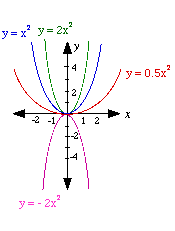
(a) y = ax 2 The a has the effect of changing the parabola in the y- direction. It affects the steepness of the graph.
|
 |
|
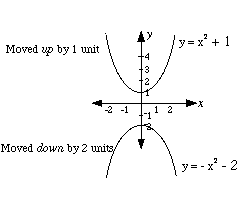
(b) y = x 2 + k The k has the effect of moving the parabola along the y-axis by k units.
|
|
|
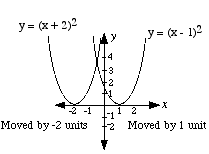
(c) y = (x − h)2 The h has the effect of moving the basic parabola along the x-axis by h units.
|
|
Download an interactive spreadsheet (Microsoft Excel) showing the transformation of parabolas.
(Windows users, right click and "Save target as..." to save the files on your computer.)
Note
If the function does not factorise, either complete the square (example), or use the quadratic formula.
If the function has no roots, i.e. It does not factorise and the quadratic formula cannot be used (the discriminant is negative) then some points have to be plotted.

