 An outcome is the result of an experiment such as throwing a die or picking a card from a pack. A trial is each time the die is rolled or a card picked. The sample space is the set of all possible outcomes and an event is part of the sample space.
| Term | Meaning | Example |
| Experiment | A process for which the result depends on chance and cannot be predicted. | throwing a pair of dice |
| Trial | One performance of an experiment. | one rolling of the dice |
| Outcome | The result of a single trial. | the result of throwing the dice e.g. (1, 2) |
| Event | A subset of the sample space. | scoring an odd total |
| Sample space | The set of all possible outcomes. |
all possible outcomes from |
Theoretical Probability
For equally likely outcomes, the theoretical probability of the event E occurring is given by:
Probability of event E happening =
Probabilities are expressed as fractions, decimal fractions or percentages.
|
When a die is tossed, what is the probability that a 5 or a 6 will face up? |
Total six possible outcomes = {1, 2, 3, 4, 5, 6} Required two outcomes= {5, 6}
|
|
A card is picked from a normal pack of 52. What is the probability the card will be a heart? |
There are 52 cards in a pack. There are 13 hearts. P(Heart) = 13/52 = 0.25 |
Probabilities will always be in the range from 0 to 1.
If the probability of an event happening is 0, the event cannot occur.
e.g. P(throwing a six-sided die and scoring a 7) = 0
If the probability of an event happening is 1, the event is certain to occur.
With all experiments, the sum of the probabilities of all possible outcomes is 1.
Experimental Probability
As well as working out probabilities from theory. i.e. Cards, dice and coins, another way is to actually carry out experiments and examine the results.
Example
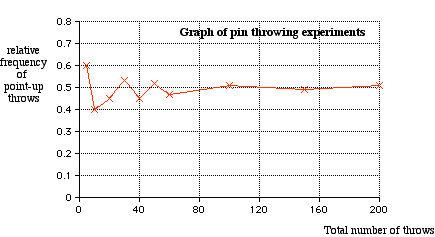
Suppose that, for some strange reason, we want to find the probability that a drawing pin lands point-up when thrown in the air.
The pin is thrown in the air and the number of times it lands point-up or point down is recorded. This experiment is repeated several times for different numbers of throws.
The results are recorded below and the relative frequencies of the number of times the pin lands point-up are calculated.
|
Number of times pin lands point up
|
Total number of throws
|
Relative frequency
|
|
3
|
5
|
|
|
4
|
10
|
|
|
9
|
20
|
|
|
16
|
30
|
|
|
18
|
40
|
|
|
26
|
50
|
|
|
28
|
60
|
|
|
51
|
100
|
|
|
74
|
150
|
|
|
102
|
200
|
|
These results can be shown on a graph.

It seems that as the number of throws in the experiments is increased the relative frequency tends towards 0.5.
This is called the long-run relative frequency or the experimental probability.