1. The set of values below are to be modelled by an exponential function y = Aekx.
|
x
|
1
|
2
|
3
|
4
|
5
|
|
y
|
895
|
1335
|
1992
|
2972
|
4433
|
a. By plotting x against ln y, show that this is an appropriate model.
b. Find the values of k and A.
c. Find the value of y when x = 9
2. A skiing hire company predicts that with the increasing populariy of snowboards, the hire of skis will decline according to the exponential equation S = Aekt.
S is the number of pairs of skis hired per month, t is the time in months, A and k are constants.
The company currently hires out 2800 pairs of skis per month and the hire figures for the next 6 months are predicted to be as follows:
|
t (time, months)
|
S (number of skis hired )
|
ln S (to 2 d.p.)
|
|
0
|
2800
|
7.94
|
|
1
|
2292
|
|
|
2
|
1877
|
|
|
3
|
1537
|
|
|
4
|
1258
|
|
|
5
|
1030
|
|
|
6
|
843
|
a. By completing the table, sketch a graph of t against ln S and use it or the values in the table to find the values of A and k.
b. Using the company model how many months will it take before the number of skis hired falls below 500.
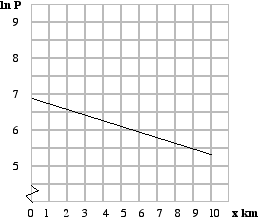
3. The atmospheric pressure P(millibars) depends on altitude. The graph below shows ln P plotted against the altitude x km based on measurements from a weather balloon.

a. Find the pressure at ground level.
Since the graph is approximately a straight line we may assume that ln P is given by mx + c for some constants m and c.
b. With this assumption show that P = kemx where k is a constant.
c. What pressure does k represent in part b?
d. From the graph estimate a value for the constant m.