Draw a graph of each of these piecewise functions.
1. ![]()
2. ![]()
3.![]()
4. ![]()
5. 
6. 
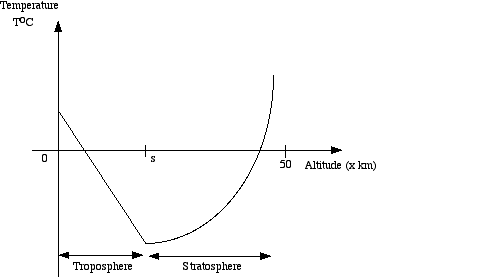
7. The temperature T°C in the lower layers of the atmosphere depends on the altitude x km. A typical graph of T is shown below. Notice that, as the altitude increases, the temperture initially falls (in the part of the atmosphere called the "troposphere") and then rises (in the "stratosphere"). The altitude at the boundary of the troposphere and the stratosphere is marked s on the graph.

Weather balloons are released daily from a meteorological station in Central Otago to collect atmospheric data including temperature and pressure. Based on one day's measurements it is found that the temperature T is given by:
a. Find the temperture at ground level.
b. Find the decrease in temperature for each 1 km increase in altitude in the troposphere.
c. Solve a quadratic equation to find the altitude s.
d. Find the temperature at an altitude of 14 km.