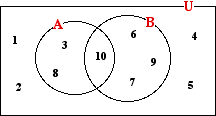
 Venn diagrams are useful for showing sets, and situations involving probability.
Venn diagrams usually consist of a rectangle which shows the univeral set, U or total sample space, and circles which show sets or events.
Set Symbols
To refresh memories about the set notation, this table is copied from an earlier topic.
|
Symbol
|
Meaning
|
Example
|
|
U or ξ
|
the universal set | the set of all elements or members being considered. |
|
φ or {}
|
the empty or null set | This set has no elements or members. |
|
|
is a member of | 2 |
|
|
is not a member of | 3 |
|
|
is a subset of | {3, 4} |
|
n(A)
|
the cardinal number (number of members) of set A. |
if A = {4, 5, 6, 7, 8} |
|
A'
|
the complement of A. All the members not in A |
If A = {4, 5, 6, 7, 8} and the universal set is {whole numbers less than 10 then A' = {0, 1, 2, 3, 9} |
|
|
the union of sets |
If A = {4, 5, 6, 7, 8} and B = {3, 4, 5} then |
|
∩
|
the intersection of sets | If A = {4, 5, 6, 7, 8} and B = {3, 4, 5} then A ∩ B = {4, 5} |
Venn Diagrams with Two Sets
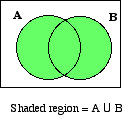
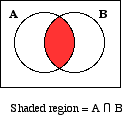
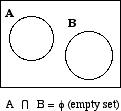
Venn diagrams can contain two sets and the following arrangements are some of those possible.
|
Union of two sets
|
Intersection of two sets
|
Disjoint sets
|
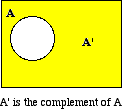
Complement of a set
|
 |
 |
 |
 |
Example
|
The Venn diagram below shows the universal set
|
Find:
|
Answers:
|
|
a. B ' b. c. d. |
a. B ' = {1, 2, 3, 4, 5, 8} b. c. d. |
Venn Diagrams with Three Sets
Venn diagrams can contain three or more sets.
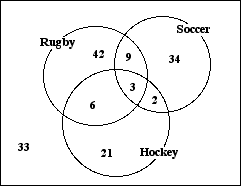
The Venn diagram below shows the sports played on a weekend by 150 boys.
 |
 |
 |
From the diagram it can be seen that:
| 60 boys play rugby | (42 + 9 + 3 + 6) | {rugby} |
| 5 boys play both soccer andhockey | (3 + 2) | {soccer} |
| 3 boys play all three sports | 3 | {rugby} |
|
96 boys play either soccer or rugby |
(42+9+3+6)+(34+9+3+2) − (9+3) | {rugby} |
Note that thirty three boys play no sport at the weekend.
