|
Q1:
|
Using the graph above, which shows the areas of some of a countiry's lakes, what is the area of thesmallest lake?
|
A. 3 sq. km
B. 32 sq. km
C. 23 sq. km
D. 8 sq. km |
Answer 1: |
|
|
Q2:
|
Using the stem and leaf graph for the areas of the country's lakes shown above, what is the biggestarea for a lake? |
A. 80 sq. km
B. 88 sq. km
C. 8 sq. km
D. 87 sq. km |
Answer 2: |
|
|
Q3:
|
Using the stem and leaf graph for the areas of the country's lakes shown above, how many lakes are shown on the graph? |
A. 80
B. 23
C. 7
D. 13 |
Answer 3: |
|
|
Q4:
|
Using the stem and leaf graph for the areas of lakes shown above, what is the MEDIAN area for a lake? |
A. 47 sq. km
B. 50 sq. km
C. 39 sq. km
D. 74 sq. km |
Answer 4: |
|
|
Q5:
|
The tree diagram below shows the possible outcomes of throwing two coins one after another.
How many different combinations of outcomes are there?
|
A.1
B .2
C. 3
D. 4
|
Answer 5: |
|
|
Q6:
|
What would the probability be of getting two heads from the tree diagram above?
|
A. 0
B. 0.25
C. 0.5
D. 1.0 |
Answer 6: |
|
|
Q7:
|
 |
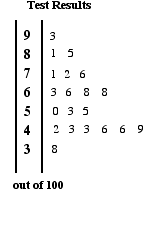
The stem and leaf graph shows the test results of a class of students.
How many students are there in the class?
|
|
A. 9
B. 7
C. 27
D. 20 |
Answer 7: |
|
|
Q8:
|
What was the highest mark scored in the test above? |
A. 39
B. 83
C. 93
D. 98 |
Answer 8: |
|
|
Q9:
|
Which mark was the fourth highest in the class? |
A. 71
B. 64
C. 72
D. 76
|
Answer 9: |
|
|
Q10:
|
Which mark was the lowest in the test? |
A. 83
B. 39
C. 8
D. 38 |
Answer 10: |
|