 As well as straight line coordinate graphs there are many functions whose graphs have different shapes.
These functions will become more important in future years.
Below are some examples of the different types of functions and their graphs are sketched by plotting points.
Parabolas
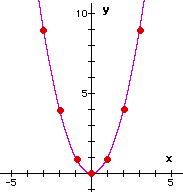
A parabola is a curved graph produced by a quadratic function, one which contains a "squared" x-term.
|
y = x2
|
This shape is called a parabola. |
Hyperbolas
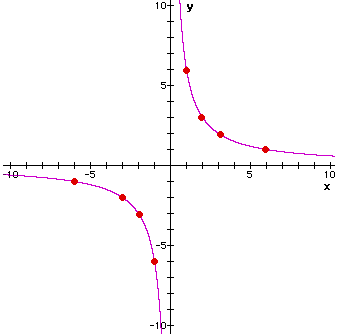
The equation of a hyperbola contains an x-term and a y-term multiplied together. The general equation is xy = c, where c is a constant.
|
xy = 6
x multiplied by y has to always be 6. The lines x = 0 and y = 0 on the graph are called asymptotes. They are not crossed by the curves. |
This shape is called a hyperbola. |
Growth Curves
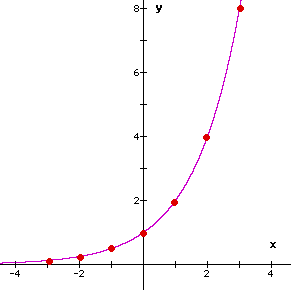
The equation of a growth curve has a power of x. The general equation is y = ax, where a is a constant.
|
y = 2x
Check these results using the The x-axis is an asymptote. |
This shape is called a growth curve or an exponential function. |
Circles
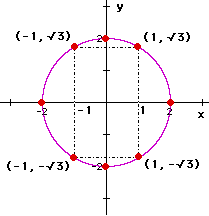
The equation of a circle contains an x2 and a y2 term. The general equation is x2 + y2 = r2, where r is the radius.
|
x2 + y2 = 4
The middle terms above, in red, have to always add to 4. |
This shape is called a circle. |


