Quadratic functions have graphs that are parabolas.
The general equation of a quadratic function can be given in two forms:
In both forms the highest exponent of x is 2.
The vertex, stationary point or turning point gives either the maximum or minimum value of the function.
 Sketching Parabolas
Method 1: Factorisation.
If the equation is in the form y = ax2 + bx + c the following method should be used:
Step (a) Factorise the function.
Step (b) Find the x- and y-intercepts by putting y = 0 and x = 0.
Step (c) Find the axis of symmetry − always midway between the two x-intercepts.
Step (d) Find the coordinates of the vertex or turning point.
|
Answer
|
||
|
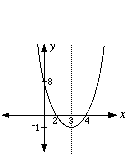
Sketch the graph of the function y = x2 − 6x + 8 |
Step (a) y = x2 − 6x + 8 = (x − 4)(x − 2) Step (b) Put x = 0 into the equation. y = 02 − 6 × 0 + 8 The y-intercept is 8 Put y = 0 0 = (x − 4)(x − 2) The x-intercepts are 4 and 2 Step (c) Axis of symmetry is always midwaybetween the x-intercepts. Axis of symmetry is the line x = 3 Step (d) The vertex occurs at x = 3 When x = 3 The vertex is at the point (3, -1) |
Now sketch the graph |
:
Method 2: Transformation.
This method finds the coordinates of the vertex.
The y-intercept is found by putting x = 0.
The graph of the basic parabola y = x2 is shown in the diagram.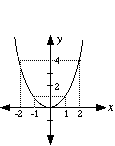
This basic parabola is moved or transformed as follows.
|
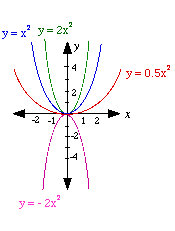
(a) y = ax 2 The a has the effect of changing theparabola in the y- direction. It affects the steepness of the graph.
|
 |
|
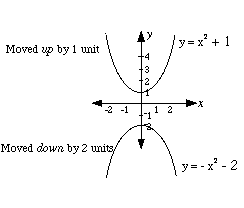
(b) y = x 2 + k The k has the effect of moving the parabola along the y-axis by k units.
|
|
|
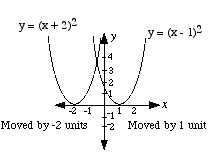
(c) y = (x − h)2 The h has the effect of moving the basic parabola along the x-axis by h units.
|
|
