A rate compares two quantities of a different kind.
 Rates of change
Graphs and tables can be used to show the rates at which chosen variables are changing with time.
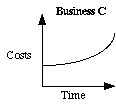
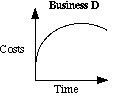
e.g. The following graphs show the costs of running several businesses over the past 6 months.
 |
The costs are rising steadily |
 |
The costs have been rising but now seem to have levelled out. |
 |
The costs are rising at an increasing rate. |
 |
The costs are falling after having reached a peak. |
As can be seen from these graphs, rates of change can be represented by linear (straight line) graphs or non-linear graphs, such as growth curves.
For Business D the information on the graph could have been shown in a table:
Rates
A rate compares two quantities of a different kind.
e.g. Speed is a rate which compares distance travelled with time
Speed = kilometre per hour
Wage rate = Dollars per week
|
A woman earns $425 in 50 hours. What is her hourly rate of pay? |
Rate of pay = |
|
A motorist travels 85 km in 2 hours. What is his speed? |
Speed =
|
Gradients and Rates
On a straight line graph the gradient is a measure of the rate at which one variable is changing with respect to the other variable. The larger the gradient, the quicker the rate of change.
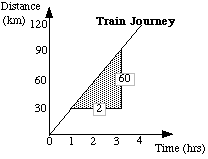
e.g. The distance travelled by a train going at a constant speed is shown below.
From the table the speed = 120/4 = 30 km/hr
This data can be shown on a graph:

From the graph, the gradient = the speed = 60/2 = 30 km/hr.