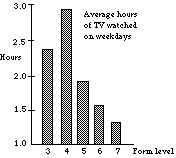
(a) Form 3 mean = 2.37 (to 2 decimal places)

Form 4 mean = 2.97

Form 5 mean = 1.93

Form 6 mean = 1.60

Form 7 mean = 1.37

Bar graph of means
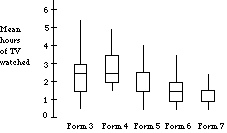
(b)

Form 3

Form 4

Form 5

Form 6

Form 7

0.5

1.5

0.5

0.5

0.5

0.5

1.5

0.5

0.5

0.5

1.0

2.0

1.0

1.0

1.0

1.5

2.0

1.5

1.0

1.0

1.5

2.0

1.5

1.0

1.0

2.0

2.5

1.5

1.0

1.0

2.0

2.5

1.5

1.5

1.0

2.5

2.5

1.5

1.5

1.5

2.5

3.5

2.0

1.5

1.5

2.5

3.5

2.5

2.0

1.5

2.5

3.5

2.5

2.0

1.5

3.0

4.0

2.5

2.0

1.5

3.5

4.0

2.5

2.5

2.0

4.5

4.5

3.5

2.5

2.5

5.5

5.0

4.0

3.5

2.5

As there are 15 results for each level the median will be the 8th one. The lower quartile will be the 4th result and the upper quartile will be the 12th result.


c. Except for the anomaly at 4th form level, the more mature pupils become the less TV they watch!